Daoqin Tong
Arizona State University
Food Access During the COVID-19 Pandemic
The COVID-19 pandemic has significantly affected daily activities and travel behavior worldwide. Among others, unemployment rates have pushed millions of families into food insecurity, and the social distancing requirement and fear of contracting COVID-19 have changed the way that people access food with many people replacing in-store visits with online food shopping. This study examines food access under the challenges brought about by the COVID-19 pandemic. Research has been conducted to study the food shopping behavior during COVID-19, including panic buying, changes in diet habits and food shopping methods. However, they paid limited attention to the travel associated with food shopping. In this study, we present the impact of COVID-19 pandemic on food access and how the impact changes in different areas/regions.
We examine food shopping visits to grocery stores in six large metropolitan areas: New York City, Los Angeles, Chicago, Dallas, Phoenix and Seattle. The grocery stores in these areas were grouped into 5 categories, including supermarkets, large retailers, specialty stores, warehouse clubs and convenience stores (Table 1). Figure 1 shows the number of grocery stores in each metropolitan area. In these metropolitan areas, New York City has the most number of grocery stores (9,016) and Phoenix has the least number of grocery stores (1,682). Among all the stores, Figure 2 shows that convenience stores account for the largest proportion in each metropolitan area, followed by supermarkets.
Table 1. Grocery Store Categories
| Category | Brands |
| Supermarket | Albertsons Bashas’ Food City Fry’s Safeway et al. |
| Large Retailer | Target Walmart |
| Specialty Store | Sprouts Trader Joe’s Whole Foods Ethnic Grocery Stores |
| Warehouse Club | Costco Sam’s Club et al. |
| Convenience Store | 7-Eleven AMPM Circle K et al. |
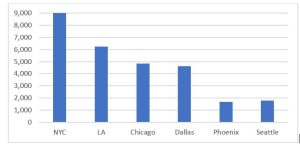
Figure 1. Number of Grocery Stores in Six Metropolitan Areas
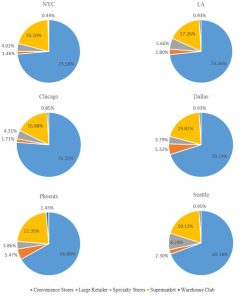
Figure 2. Grocery Stores in Six Metropolitan Areas
The grocery store visit flows before (April and May in 2019) and during COVID-19 (April and May in 2020) are compared based on the data provided by SafeGraph. The visit flows are estimated on a sample of mobile phone users (16 years old or above), but not on the entire population. The sample accounts for about 10% of the entire population in the U.S. with the sampling ratio varying from area to area. We calibrate the total visits based on the total population (16 years old or above) and the number of devices used in each data collection unit (e.g., census block groups).
Figure 3 shows the temporal changes of the total grocery store visits in the six metropolitan areas. Overall, residents in LA had the most grocery store visits, followed by New York City. Overall, we noticed a different store visit patterns in the six metropolitan areas. Compared to April 2019, in April 2020 during the very initial stage of COVID-19 LA had a decreased amount of grocery store visits (e.g., LA) while a few other metropolitan areas (e.g., Dallas) experienced an increase amount of store visits. Figure 4 presents the temporal variation of visits to different types of grocery stores. The figure suggests that in April 2019, people have reduced visits to convenience stores and specialty food stores while having increased visits to large retailers, supermarkets and warehouse clubs.
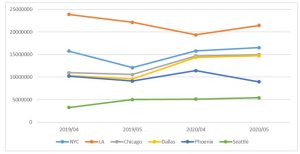
Figure 3. Grocery Store Visits
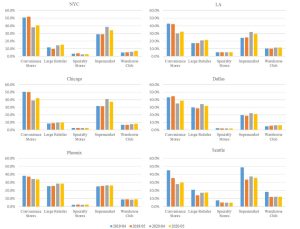
Figure 4. Temporal Variation of Visits to Different Types of Stores
As for the average travel distance (Figure 5), on average people in Los Angeles had the shortest travel distance to grocery stores, while residents in Dallas had the longest travel distance. Figure 5 shows that in all the six metropolitan areas, travel distances during COVID-19 are shorter than those before COVID-19. We also notice that people in these six metropolitan areas tended to use grocery stores closer to their home than the other three months. Figure 6 shows the travel distance to different types of grocery stores. Overall, the convenience stores and warehouse clubs people used are farther from their homes. Compared to other types of grocery stores, the travel distance to warehouse clubs had minimal changes during the initial stage of COVID-19.
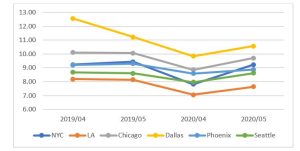
Figure 5. Average Weighted Distance from Home to Grocery Store (km)
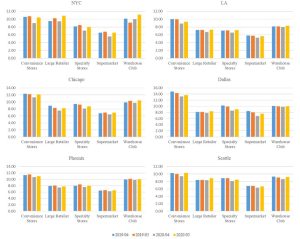
Figure 6. Average Weighted Distance from Home to Different Types of Grocery Stores (km)
