Jayajit Chakraborty
University of Texas at El Paso
Developing a Disability Vulnerability Dashboard
Authors: Jayajit Chakraborty and Katalina Salas, Socio-Environmental and Geospatial Analysis (SEGA) Lab, University of Texas at El Paso
Available at: https://tinyurl.com/SEGALabDVD
People with disabilities (PwDs) represent a highly vulnerable group that is significantly more likely to be injured or die than non-disabled individuals during the COVID-19 pandemic, as well as other public health emergencies and natural disasters. Adverse impacts and health risks faced by PwDs during such events are often amplified because of their socioeconomic (e.g., poverty), demographic (e.g., age), and/or racial/ethnic (e.g., minority) status.
The Disability Vulnerability Dashboard (DVD) is an interactive geospatial database that can help emergency response planners, public health officials, and other stakeholders identify, visualize, and plan support for PwDs. It also serves as a internet-based educational tool for learning and understanding the spatial variability, diversity, and social vulnerability of PwDs in the US.
The DVD uses data from the 2019 US American Community Survey (ACS) five-year estimates to calculate and display disability-related indicators for each US county. The ACS defines PwDs as members of the civilian non-institutionalized population who reported having serious hearing, vision, cognitive, ambulatory, self-care, and/or independent living difficulties. To enable mapping and analysis of relative vulnerability for PwDs, each US county is ranked with respect to all counties in the 50 US states and the District of Columbia. County rankings are based on percentile scores that can viewed and compared using this dashboard.
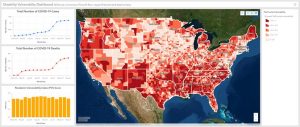
The current version of the DVD also includes graphs that depict monthly trends in COVID-19 cases, COVID-19 deaths, and Pandemic Vulnerability Index (PVI) scores for each US county. The PVI scores are based on the PVI model developed by the National Institute of Environmental Health Sciences (NIEHS), which integrates multiple variables into a county-level score based on 12 indicators that encompass four domains: infection rates, baseline population concentration, intervention measures, and existing health and environmental vulnerabilities. More information on the COVID-19 PVI model and online dashboard is available here: COVID-19 Pandemic Vulnerability Index Quick Start Guide (nih.gov).
The DVD contains two major components (map layers on PwDs) that are described below.
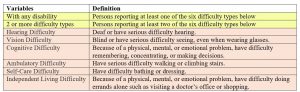
A. Type of Disability: This component includes the percentage of people reporting each type of difficulty (hearing, vision, cognitive, ambulatory, self-care, and independent living), percentage of PwDs reporting multiple disabilities, and the overall percentage of PwDs in each US county. All percentage estimates are based on the total civilian non-institutionalized population in the county. The definition of each disability category or variable is provided in the table below:
The DVD lists the percentages of PwDs in each category, as well as their percentile ranks based on comparison with all US counties. Percentile ranking values range from 0 to 1, with higher values indicating higher percentages of PwDs in the category.
B. Social Vulnerability of PwDs: The second component includes multiple indicators of social vulnerability for PwDs in the county, based on variables from the 2019 ACS five-year estimates that are organized into three dimensions: economic status, demographic status, and racial/ethnic minority status. Each US county receives a separate percentile rank for each of these three dimensions, as well as an overall social vulnerability rank for PwDs that integrates these three dimensions, as summarized in the table below:
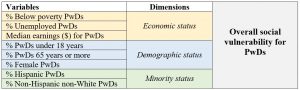
The percentages of each variable listed in the table above are based on total civilian non-institutionalized population, with two exceptions. The % Below poverty PwDs are based on the civilian non-institutionalized population for whom poverty status is determined and % Unemployed PwDs is based on civilian non-institutionalized population in the labor force (aged 18-64 years).
Methodology: For each of the three dimensions of social vulnerability for PwDs, the percentiles for the variables comprising each dimension are summed. The summed percentiles for each dimension are then rank ordered to determine dimension-specific percentile rankings (i.e., economic, demographic, and minority status). Each county receives a separate percentile score for each dimension that ranges from 0 to 1, with higher values indicating higher percentages of socially vulnerable PwDs. Overall social vulnerability scores for PwDs in each county are estimated by summing the sums for each dimension, rank ordering the counties, and then calculating an overall percentile ranking. It should be noted that calculating the sum of the sums for each dimension is the same as summing individual variable rankings.
Dashboard Navigation
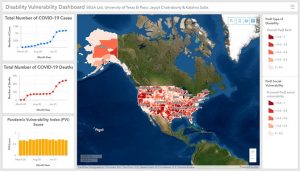
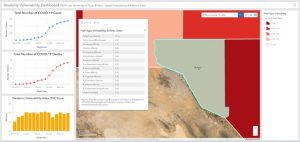
When we open the dashboard, we see a choropleth map with a single layer (PwD Type of Disability) and three graphs on the left. This map layer was chosen as the first to be displayed to ensure easy navigation and visualization of disability characteristics, but a second map layer is available on this dashboard (PwD Social Vulnerability). We can toggle between these two map layers by clicking on the layer icon located in the middle toolbar to the right of the search tool.
The first map layer focuses on PwD Type of Disability, where counties are ranked (percentile rank: 0.0 to 1.0) and classified into five categories based on the percentage of civilian non-institutionalized population with any disability, as shown below in the map legend on the right.
We can select any county by using the Search tool or using Zoom tool in the toolbar to locate the county and clicking inside its boundary. Clicking on the selected county (e.g., El Paso County, Texas) on the map will activate the county-specific COVID-19 information panel on the left and a pop-up display window, as shown in the screenshot below. The COVID-19 information panel includes three graphs for the selected county that depict monthly data on the total number of COVID-19 cases, total number of COVID-19 deaths, and Pandemic Vulnerability Index (PVI) scores, respectively (from the first day of each month, starting from March 1, 2020). The pop-window for the Type of Disability layer shows the county percentages and percentile ranks of each type of disability, which allows comparison with all counties in the US. With an overall PwD rank of 0.33, El Paso County is almost in the bottom one-third (lowest 33%), in terms of the overall disability percentage.
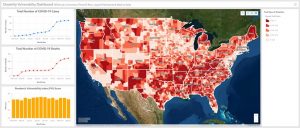
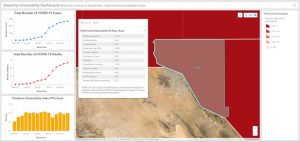
For this second map layer that focuses on PwD Social Vulnerability, counties are ranked and classified based on relative social vulnerability of PwDs. The county percentile score associated with the overall social vulnerability of PwDs (combination of economic, demographic, and minority status) is used to classify counties into five categories, as shown below in the map legend on the right.
If we click again on El Paso County, we can view the same information on monthly COVID-19 cases, deaths, and PVI scores on the left. But this pop-window shows a separate percentile rank for each of the three dimensions of social vulnerability for PwDs (economic, demographic, and minority status), as well as an overall percentile rank based on combining these three dimensions—useful for comparison with all counties nationally. The disability-specific variables used to derive these three indicators and the overall rank for social vulnerability can also be viewed in this pop-window. With an overall percentile rank of 0.77, El Paso County is in the top 25% nationally in terms of the presence of socially vulnerable PwDs (although it is in the bottom 33% for overall percentage of PwDs).
More information and documentation for the Disability Vulnerability Dashboard , as well as the data associated with the DVD map layers is available on the DVD GitHub Project page: https://github.com/jayajitc/DVD. We are also planning to expand the database to include census tract level data layers on type of disability and social vulnerability of PwDs.
