Jayajit Chakraborty
University of Texas at El Paso
COVID-19 and People with Disabilities
The first phase of my project focuses on the relationship between COVID-19 prevalence and people with disabilities (PwDs) at the county level in the continental U.S. (lower 48 states and Washington DC). Data on the latest number of confirmed COVID-19 cases were retrieved from the Johns Hopkins University Coronavirus Resource Center on December 25, 2020, for all 3,108 counties in the continental U.S. Data on disability characteristics of the population, including types of difficulty and socio-demographic characteristics, were obtained from the 2018 American Community Survey (ACS) five-year estimates. The ACS defines PwDs as members of the civilian non-institutionalized population who reported having serious hearing, vision, cognitive, ambulatory, self-care, and/or independent living difficulties on the ACS form. The civilian non-institutional population includes people who are not inmates of institutions (e.g., penal and mental facilities, homes for the elderly), and who are not on active duty in the Armed Forces.
The county level distributions of COVID-19 incidence rate (cases per 100,000 people) and overall disability percentage (people reporting any disability-related difficulty/total civilian non-institutionalized population) are first depicted using separate choropleth maps in Figure 1 below, where each variable is classified into four quartiles.
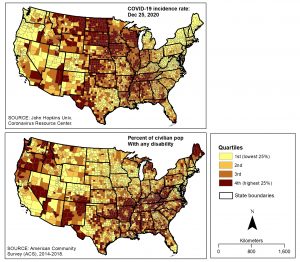 Figure 1. County level distributions of COVID-19 incidence rate and people with disabilities in the continental USA.
Bivariate analysis focused on using local indicators of spatial association (LISA) to identify U.S. counties where significantly greater COVID-19 prevalence coincides with higher percentages of PwDs. Specifically, the local bivariate Moran’s I statistic (Anselin 1995) was utilized to estimate geographic clusters of counties based on the statistical relationship between COVID-19 incidence rate and the percentage of PwDs. To identify clusters of significant associations and counties where these associations are statistically significant, 999 random permutations and a significance level of 0.05 were used. Four statistically significant categories of spatial association can be derived from this Moran’s I statistic, with high-high and low-low categories for spatial clustering of similar values (positive relationships), and high-low and low-high categories for spatial clustering of dissimilar values (negative relationships). In this case, the high-high category implies that high COVID-19 incidence rate in a county is significantly associated with a high percentage of PwDs in neighboring counties (p<0.05), while low-low category indicates that a county with low COVID-19 incidence is significantly associated with higher percentage of PwDs in neighboring counties (p<0.05). Spatial contiguity was assessed using an adaptive kernel approach and all analyses were conducted using the open-source spatial analysis software program GeoDa.
The results are shown in Figure 2 below, where each county is classified into five clusters (number of counties in parentheses) based on the nature and significance of spatial correlations between COVID-19 incidence rate and the percentage of PwDs. The high-high category, which represents significantly higher COVID-19 incidence associated with higher percentage of PwDs, contains 354 or almost 11.4% of counties in the continental U.S. These counties are located mainly in the states of Arkansas, Alabama, Mississippi, and Tennessee. The top five counties in the high-high category, based on the bivariate local Moran’s I values, are named on this map. In these five counties, both COVID-19 incidence rates and the overall percentage of PwDs are more than twice as high compared to their respective national averages.
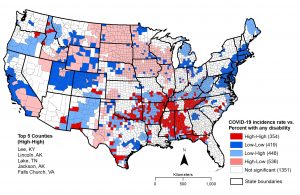
Figure 2. Spatial clusters based on association between COVID-19 incidence and percent with any disability
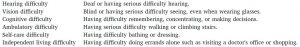
A similar approach was used to examine spatial relationships between COVID-19 incidence and each type of difficulty reported by PwDs in the 2018 ACS. County percentages for each of these disability subgroups were calculated by dividing the number of PwDs reporting each difficulty type by the total civilian non-institutionalized population relevant to the variable category. Definitions of each difficulty type are given below:
The next set of maps (Figure 3) summarize the results of cluster analysis for each disability subgroup based on the bivariate Moran’s I statistic. The top five counties in the high-high category for each type of difficulty are identified on each map. These maps also indicate a concentration of ‘high-high’ counties in New Mexico and southern Texas for most difficulty types—a pattern that was not identified when the overall disability percentage was used (Figure 2).
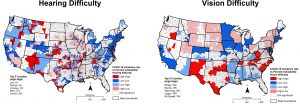
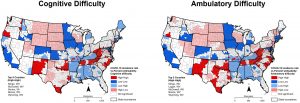
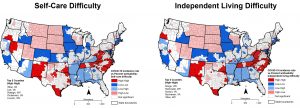
Figure 3. Spatial clusters based on the association between COVID-19 incidence and percent in each disability subgroup
The next step of the analysis will focus on disaggregating PwDs based on various socio-demographic characteristics, including race, ethnicity, poverty status, age, and gender.
