The Context Makes the Difference: Reproducibility and Replicability in Measures of Spatial Accessibility
Group 6: Yuqin Jiang + Jinwoo Park + David Lafferty + Forrest Bowlick + Xuan Zhang + Alex Timmons
Mentor: Coline Dony
Run the first cell block below to get started and find out who we are!
from functions import widget
import folium

m = folium.Map(location=[50.044265, -85.316334], zoom_start=3, tiles = 'OpenStreetMap')
fig = folium.Figure(width=950,height=300)

# Yuqin
icon_usc_link ="./pictures_for_pre/icons/usc.png"
icon_usc = folium.features.CustomIcon(icon_usc_link, icon_size=(34, 36))
folium.Marker([33.995723, -81.027936], popup='<b>Yuqin Jiang</b>'+'\n'+'University of South Carolina', icon = icon_usc).add_to(m)

# Jinwoo
icon_tamu_link ="./pictures_for_pre/icons/tamu.png"
icon_tamu = folium.features.CustomIcon(icon_tamu_link, icon_size=(70, 58))
folium.Marker([30.618226, -96.337175], popup='<b>Jinwoo Park</b>'+'\n'+'Texas A&M University', icon = icon_tamu).add_to(m)

# UIUC are same location
icon_uiuc_link ="./pictures_for_pre/icons/uiuc.png"
icon_uiuc = folium.features.CustomIcon(icon_uiuc_link, icon_size=(20, 33))
folium.Marker([40.101885, -87.8], popup='<b>Alex Timmons, David Lafferty</b>'+'\n'+'University of Illinois at Urbana-Champaign', icon = icon_uiuc).add_to(m)

# Xuan
icon_UGA_link = "./pictures_for_pre/icons/uga.png"
icon_UGA = folium.features.CustomIcon(icon_UGA_link, icon_size=(30, 42))
folium.Marker([33.948361, -83.377268], popup='<b>Xuan Zhang</b>' +'\n'+ 'University of Georgia', icon = icon_UGA).add_to(m)

# Forrest
icon_umass_link = "./pictures_for_pre/icons/umass.jpg"
icon_umass = folium.features.CustomIcon(icon_umass_link, icon_size=(38, 38))
folium.Marker([42.386514, -72.530052], popup='<b>Forrest Bowlick</b>' +'\n'+ 'University of Massachusetts Amherst', icon = icon_umass).add_to(m)

# Coline Dony
icon_aag_link = "./pictures_for_pre/icons/aag.png"
icon_aag = folium.features.CustomIcon(icon_aag_link, icon_size=(43, 43))
folium.Marker([38.904676, -77.036536], popup='<b>Coline Dony</b>' +'\n'+ 'American Association of Geographers', icon = icon_aag).add_to(m)

# bounds (list of (latitude, longitude) points) – Bounding box specified as two points [southwest, northeast]
m.fit_bounds([[30.5, -97], [42.4, -72.4]])

fig.add_child(m)
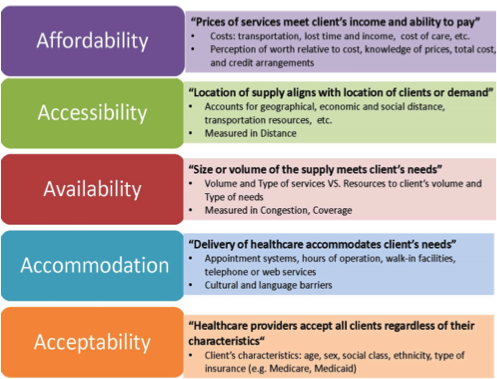 --Source: https://www.healthanalytics.gatech.edu/focus-area/access
Food desert

--Source: ottawamagazine.com
Food desert:
Regions lacking access to healthy foods as well as a range of other nutritious options. (Beaumont et al., 1995; USDA, 2013, Widener and Shannon 2014)
About 23.5 million Americans live in food deserts.
--Source: United States Department of Agriculture Economic Research Service. 2015
National food desert
 --Source: http://americannutritionassociation.org/newsletter/usda-defines-food-deserts
Regional food desert map for Champaign-Urbana
- 2006 Food Desert Map (left) defines "Low Access" as distinct between urban and rural areas
- This data, while more location specific, is out of date
- 2016 Low Access Map (right) only considers one static definition of "Low Access"
- This data, while more updated, is too generalized to be helpful at the individual user level
 --Source: Treasury Department, Health and Human Services, and the Agriculture Department (USDA), visualized by PolicyMaps
Existing problems
- Readily available maps are very general, or cover large aggregations of data
- For a fixed travel extent (i.e. 5 mile radius)
- Most are for a broad scale (census tract, or county level)
- Existing food desert visualization is outdated and static
- Not reflecting the current situation
- Not interactive
- General presentations overlook individual mobility preferences
- For different travel modes
- For various tolerable travel times
- For other personal needs and considerations: price level, rating, and more
Research questions
- What is the service area of the grocery stores in general?
- What impact do individual user preferences have on accessible food service areas?
Implementation
Data and anaysis sources
To enable our analysis, we use Open Street Map data, the Google Maps API, and Open Street Map Network X libraries.

Functionality
widget()

Advancements
- By constructing a shared base of code, analysis, and visualization, general structure of models can be shared and replicated at will.
- This format for replication allows researchers to share implementations, standardize processing, and collaborate more easily
- By opening and parameterizing the model for individual input, not only can the same model be replicated in different places, different parameters can be tuned for individual access.
- Using updated information in real time from established online sources further allows relevant modeling.
- This customizability then allows individuals (whether experts or not) to construct a model for their needs.
Future Steps
For Food Accessibility
- Include other fresh food opportunities
- Farmers market and more
- Incorporate user data to refine the general food accessibility results
- Collecting user input to understand the most favorable transportation mode and time
- Age, gender identity, socioeconomic classes, cultural background, car ownership, etc
- Collecting user input to understand the most favorable transportation mode and time
- Identify the underserved population
- To draw attention to the issue for local organizations and government
- Intergrate individual multimodal preferences into one visual
- Validation with other datasets or by survey/interviews
For Accessibility Measures in General
- Include more factors that inform the accessibility
- Other amenities
- Green space, restaurants, hospitals, etc
- Other transportation methods
- Public transportation, ride sharing, etc
- Other personal user requirements
- SNAP/food stamp eligible, wheelchair friendly, store type, etc
- Other amenities
- Add more time dimension into the measure
- User-determined time search
Summer School Outcomes
Reproducible Analysis
This model forms an outline for a reproducible basis of analyzing a metric. Through this exploration of travel time, interested parties can recreate the same analysis, using the same processor, interacitng with the same data, and acheiving the same result
Replicable Approach
By parameterizing model inputs, we allow individuals to adjust conditions based on their knowledge and experience. This provides replicability of context while preserving the underlying functionality. No need to write new code from scratch when all you need to change is travel time or mode!
How does our solution leverage CyberGIS?
Thanks to Jupyter notebooks and CyberGIS infrastructure, we've demonstrated collaborative problem sharing, exploration, and investigation. Using diverse libraries of spatial analysis, our approach exemplifies the cross-discipline nature of shared scientific discovery using CyberGIS
Collaborative nature
Our collaborations have truly linked our diverse skillsets and capacities. In starting from a general problem outline, without a base of code to build on, we created a wonderfully functional example of collaborative, CyberGIS-enabed research. Given our mix of academic and domain experience, we've ensured shared communication, linked goals, and accelerated each other towards solving our problem. With three members with stronger coding experience (Yuqin, David, Jinwoo), and three members with stronger theoretical background (Forrest, Xuan, and Alex), we've built a web of interaction to advance our analysis. For example, group discussions on the nature of R&R have helped inform the structure of the code and interface. By creating a space for discussion and collaboration, we've been able to construct a unified final product.
Challenges
Our primary challenge, thanks to Jupyter notebooks, was merging and sharing content. Creating the final presentation notebook was difficult since there was no version control, and no way to edit collaboratively on the same document.
Acknowledgements
Thanks to Jupyter Notebooks!
Thanks to all of the organizing entities: AAG, UCGIS, the CyberGIS Center, UIUC Geography, and everyone involved with them!
Special thanks to all of the mentors, presentors, and organizers for keeping us intellectually engaged and fueled throught this week.